Wavelength Calibration
Now we have the following frames remaining in a temporal sequence
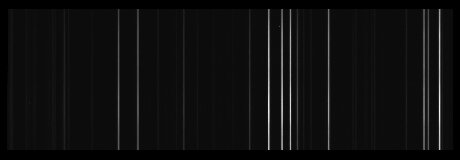
- 1 Ne = Ne1
- 1 ThAr = ThAr1
- some objects
- 1 Thar = ThAr2
So we are done with wavelength calibration.
And what to do with the other calibration frames ThAr2 and Ne1, Ne2?
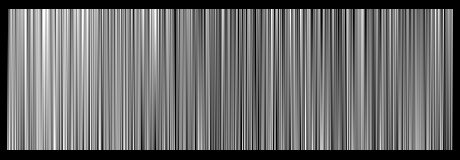
ThAr2 is needed for detect bending of the telescope mounted spectrograph. I do a
crosscorrelation of ThAr1 to ThAr2 to see the drift in wavelength during recording the
science frames. This drift is with my Lhires3 e.g. 0.04 Å.
And the neon frames? I like to play and find differences between different calibrations. The neon frames are calibrated with ThAr1 and not with themselves. I wonder how good this calibration is. To see this the wavelengths of the lines Ne1 are measured with a gauss fit and compared with the tabulated wavelength from NIST or whenceever. The wavelengths differ about ±0.03 Å. The rms-error of the eleven used lines by themselves in ThAr1 equals 0.007 Å.
Extraction
Now we dial only with the object frames. To get the true ADUs in the trace of spectrum we have to remove any background signal. This background contains light from the night sky, street lamps if you observe in the midst of a village like me, accumulated dark signal. This is found below and above the trace of the spectrum. A parabola is fitted in this regions to model the finally removed background signal.
To extract the remaining signal from the object a region is defined containing the spectrum and a little more above and below. Don't mind you get to much noise if adding pixels with small ADUs. The extraction algorithm in ESO-Midas uses a variant of Horne's Optimal Extraction Algorithm from 1986 (Horne,1986). Simply said, the pixels used are wheigted about the average intensity in its row.
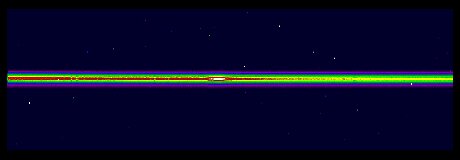
Coordinates: wavelength, number of row
Value at position: ADU
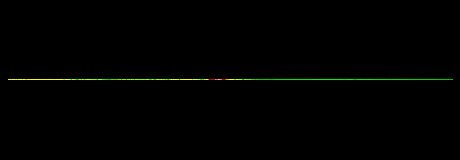
Coordinates: wavelength
Value at position: ADU
Coordinates: wavelength, ADUs used as ordinate.
Nevertheless your data is 1D. You only need one value of wavelength
to find
the intensity in your spectrum.
The extracted object spectra were then coadded i. e. small shifts are detected via correlation in wavelength direction with the first recorded object spectrum as template.
Last modified: 2024 Feb 27